Fig. 7
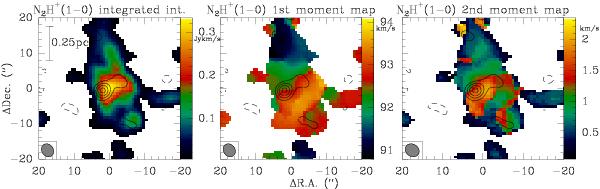
The color-scale shows the 0th, 1st and 2nd moment map of the N2H+(1–0) emission in the velocity regime between 90.5 and 94.5 km s-1 (corresponding to the integrated intensity, the intensity-weighted peak velocity and the intensity-weighted line-width, respectively). The contours present the 3.2 mm continuum emission contoured from the 3σ level in 2σ steps (1σ = 0.27 mJy beam-1). The left panel shows a scale-bar, and the PdBI synthesized beam is presented at the bottom-left of each panel. The 0/0 position is the phase center of the PdBI observations at RA (J2000.0) 18:48:02.21 and Dec (J2000.0) –01:53:55.8.
Current usage metrics show cumulative count of Article Views (full-text article views including HTML views, PDF and ePub downloads, according to the available data) and Abstracts Views on Vision4Press platform.
Data correspond to usage on the plateform after 2015. The current usage metrics is available 48-96 hours after online publication and is updated daily on week days.
Initial download of the metrics may take a while.