Fig. 6
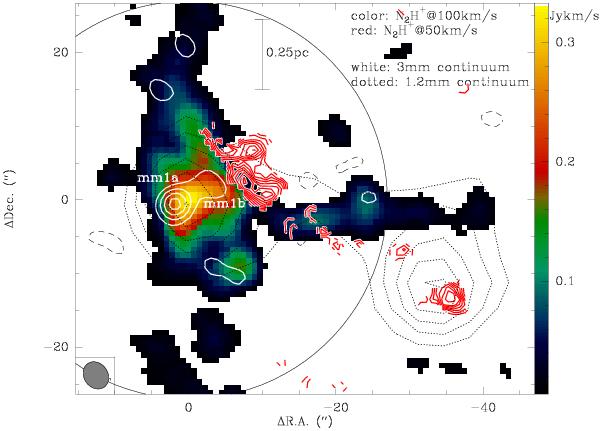
PdBI 3 mm of the clumps 1 and 2. The color-scale shows the integrated N2H+(1–0) emission within the velocity interval from 90.5 to 94.5 km s-1 whereas the red contours present the N2H+(1–0) emission within the velocity interval from 43.8 to 45.6 km s-1. The white contours show the corresponding 3.2 mm continuum emission contoured from the 3σ level in 2σ steps (1σ = 0.27 mJy beam-1). The full circle outlines that FWHM of the PdBI primary beam at the given frequency, and a scale-bar is shown as well. The PdBI synthesized beam is presented at the bottom-left. The dotted contours show the 1.2 mm continuum emission contoured in 3σ levels of 30 mJy beam-1.
Current usage metrics show cumulative count of Article Views (full-text article views including HTML views, PDF and ePub downloads, according to the available data) and Abstracts Views on Vision4Press platform.
Data correspond to usage on the plateform after 2015. The current usage metrics is available 48-96 hours after online publication and is updated daily on week days.
Initial download of the metrics may take a while.