Fig. 5
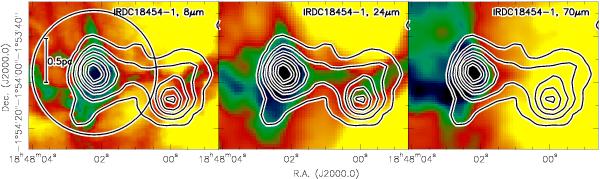
Zoom into the two central clumps 1 and 2 (see Fig. 1). The left and middle panels present in color-scale the Spitzer 8 and 24 μm emission, whereas the right panel shows the Herschel 70 μm image. Color-scale is again to highlight the main features with dark low and yellow high intensities. The contours show the 1.2 mm continuum emission contoured in 3σ levels of 30 mJy beam-1. The circle outlines the FWHM of the primary beam of the PdBI observations, and a scale-bar is shown in the left panel as well.
Current usage metrics show cumulative count of Article Views (full-text article views including HTML views, PDF and ePub downloads, according to the available data) and Abstracts Views on Vision4Press platform.
Data correspond to usage on the plateform after 2015. The current usage metrics is available 48-96 hours after online publication and is updated daily on week days.
Initial download of the metrics may take a while.