Fig. 3
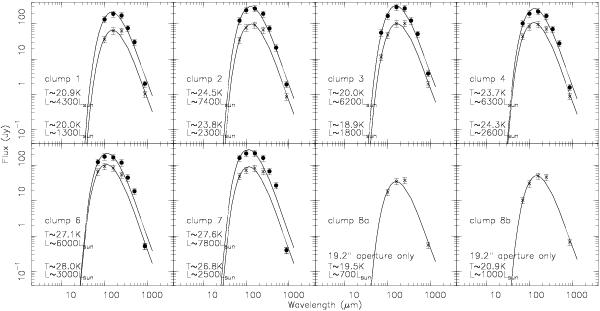
Spectral energy distributions (SEDs) of the discussed clumps. The fluxes are extracted for apertures of 36.6′′ and 19.2′′. For clumps 8a and 8b only the smaller apertures of 19.3′′ were used. Error bars represent 20% uncertainties. Each panel lists the corresponding temperatures T and bolometric luminosities L for both fits top and bottom, respectively. Clumps 1, 3 and 8a are starless clump candidates.
Current usage metrics show cumulative count of Article Views (full-text article views including HTML views, PDF and ePub downloads, according to the available data) and Abstracts Views on Vision4Press platform.
Data correspond to usage on the plateform after 2015. The current usage metrics is available 48-96 hours after online publication and is updated daily on week days.
Initial download of the metrics may take a while.