Free Access
Fig. 12
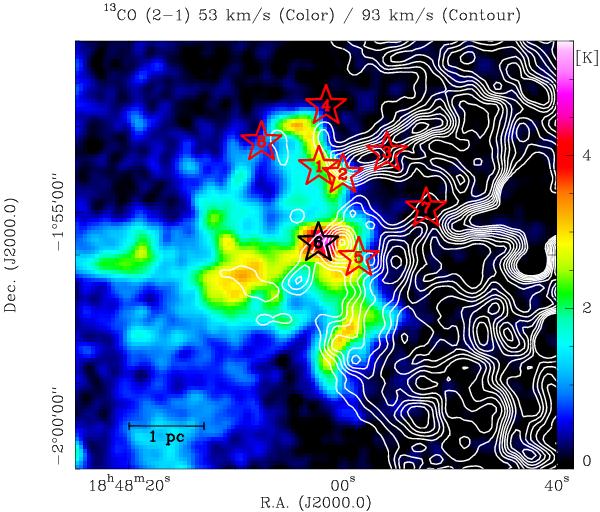
IRAM 30m 13CO(2–1) observations toward a larger part of W43 and IRDC 18454. The color-scale shows the 13CO emission around 53 km s-1 whereas the contours present gas at 93 km s-1. The stars mark the positions of our clumps 1 to 8, a scale-bar is shown at the bottom-left.
Current usage metrics show cumulative count of Article Views (full-text article views including HTML views, PDF and ePub downloads, according to the available data) and Abstracts Views on Vision4Press platform.
Data correspond to usage on the plateform after 2015. The current usage metrics is available 48-96 hours after online publication and is updated daily on week days.
Initial download of the metrics may take a while.