Fig. 11
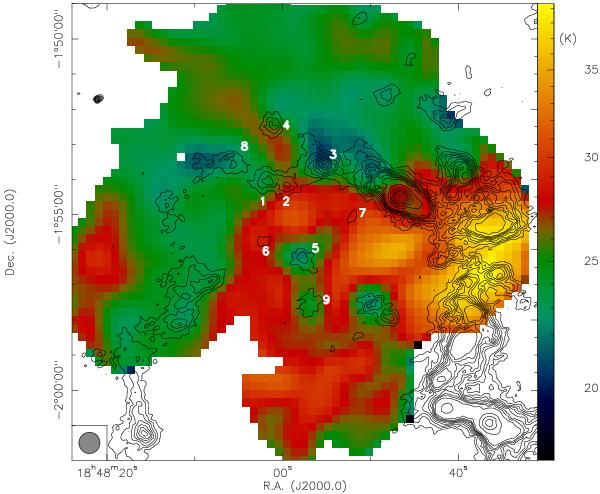
The color-scale shows a temperature map in K derived for the whole region from the combined Herschel and ATLASGAL data between 70 and 870 μm, all smoothed to the spatial resolution of the 500 μm data. Contour levels of the overlaid 870 μm data start at the 3σ levels of 0.27 mJy beam-1 and continue in in 3σ steps to 2.7 Jy beam-1, from where they continue in 2.7 Jy beam-1 steps. Our target clumps are marked.
Current usage metrics show cumulative count of Article Views (full-text article views including HTML views, PDF and ePub downloads, according to the available data) and Abstracts Views on Vision4Press platform.
Data correspond to usage on the plateform after 2015. The current usage metrics is available 48-96 hours after online publication and is updated daily on week days.
Initial download of the metrics may take a while.