Fig. 1
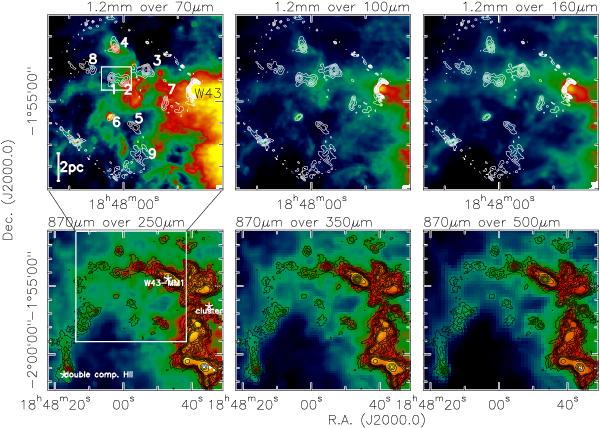
Compilation of the continuum data from 70 μm to 1.2 mm wavelength as labeled in each panel. The top-row presents the data on a smaller spatial scale as marked in the bottom-left panel. The color-scale is chosen in each image individually to highlight the most important features. Contour levels of the 870 μm data start at the 3σ levels of 0.27 mJy beam-1 and continue in in 3σ steps to 2.7 Jy beam-1, from where they continue in 2.7 Jy beam-1 steps. The 1.2 mm data are contoured in 3σ levels of 30 mJy beam-1. The numbers in the top-left panel label the sub-cores, the white small box there marks the region shown in Fig. 5, and a scale-bar for a distance of 5.5 kpc is shown as well. The crosses in the bottom-left panel mark the positions of a double-component radio recombination line Hii region from Anderson et al. (2011), the W43-MM1 position from Motte et al. (2003) as well as the approximate center of the Wolf-Rayet/OB cluster (Blum et al. 1999; Motte et al. 2003).
Current usage metrics show cumulative count of Article Views (full-text article views including HTML views, PDF and ePub downloads, according to the available data) and Abstracts Views on Vision4Press platform.
Data correspond to usage on the plateform after 2015. The current usage metrics is available 48-96 hours after online publication and is updated daily on week days.
Initial download of the metrics may take a while.