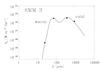
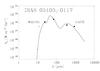
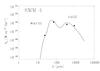
Fig. 6

Spectral energy distributions of three protostellar cores in Orion B9 built from Spitzer 24 and 70 μm, SABOCA 350 μm, and LABOCA 870-μm flux densities. Open circles in the middle panel represent IRAS data points at 12, 25, 60, and 100 μm (not used in the fit). The solid lines correspond to the two-temperature model fits to the data. Error bars (1σ) are indicated for all data points, but are mostly smaller than the symbol size. Note the appearance of a 10-μm silicate absorption feature in the SED of IRAS 05405, and the absorption “knee” at ~30 μm (most notably towards IRAS 05405) where a considerable change of κν occurs at the dust model used (OH94 and references therein).
Current usage metrics show cumulative count of Article Views (full-text article views including HTML views, PDF and ePub downloads, according to the available data) and Abstracts Views on Vision4Press platform.
Data correspond to usage on the plateform after 2015. The current usage metrics is available 48-96 hours after online publication and is updated daily on week days.
Initial download of the metrics may take a while.