Free Access
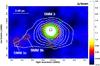
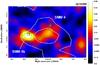
Fig. 10
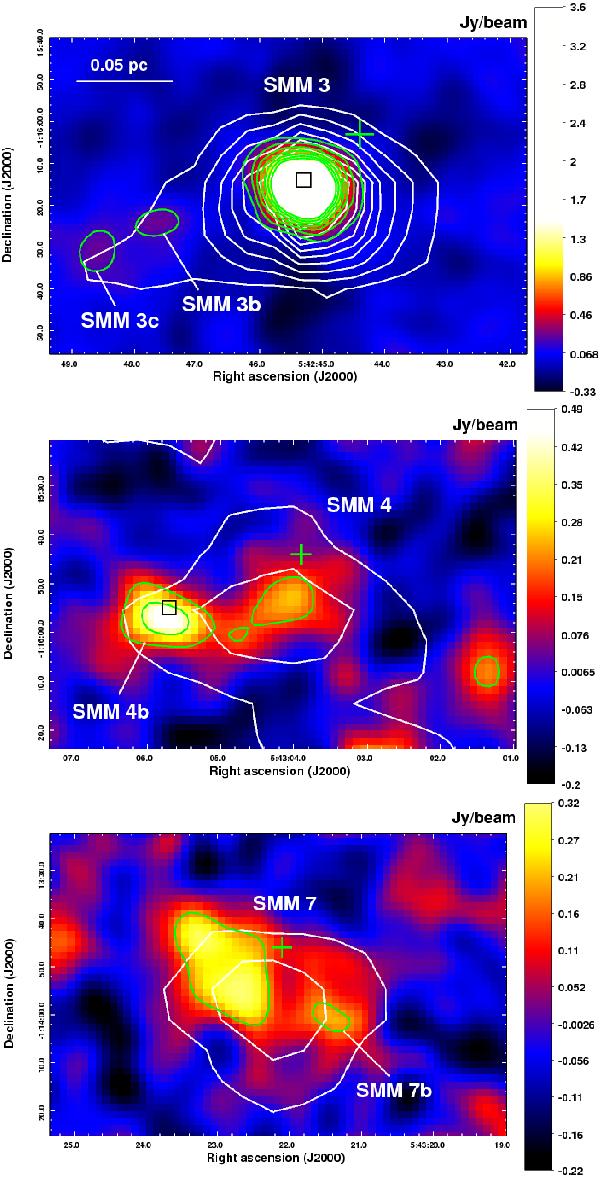
Zoom-in views of Fig. 2 with linear scaling towards SMM 3, 4, and 7. The box symbols mark the positions of the Spitzer 24-μm point sources. The green plus signs show the positions of our molecular-line observations. In each panel, the colour-bar scale corresponds to Jy beam-1.
This figure is made of several images, please see below:
Current usage metrics show cumulative count of Article Views (full-text article views including HTML views, PDF and ePub downloads, according to the available data) and Abstracts Views on Vision4Press platform.
Data correspond to usage on the plateform after 2015. The current usage metrics is available 48-96 hours after online publication and is updated daily on week days.
Initial download of the metrics may take a while.