Fig. 1
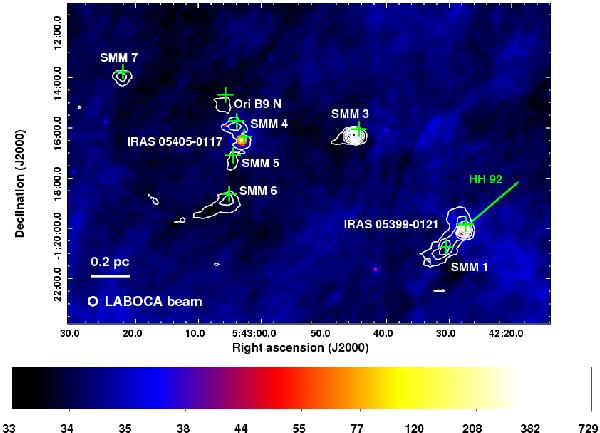
Spitzer/MIPS 24-μm image of the central part of Orion B9 overlaid with contours showing the LABOCA 870-μm dust continuum emission. The contours go from 0.1 (~3.3σ) to 1.0 Jy beam-1 in steps of 0.1 Jy beam-1. The 24-μm image is shown with a logarithmic scaling to improve the contrast between bright and faint features. The colour bar indicates the 24-μm intensity scale in units of MJy sr-1. The green plus signs show the target positions of our molecular-line observations (i.e., the submm peak positions of the LABOCA map before adjusting the pointing; see text). The green line shows the base and northwest tip of the HH 92 jet driven by IRAS 05399-0121 (Bally et al. 2002). The 0.2-pc scale bar and the effective LABOCA beam HPBW (~20″) are shown in the bottom left (Paper I).
Current usage metrics show cumulative count of Article Views (full-text article views including HTML views, PDF and ePub downloads, according to the available data) and Abstracts Views on Vision4Press platform.
Data correspond to usage on the plateform after 2015. The current usage metrics is available 48-96 hours after online publication and is updated daily on week days.
Initial download of the metrics may take a while.