Fig. 3
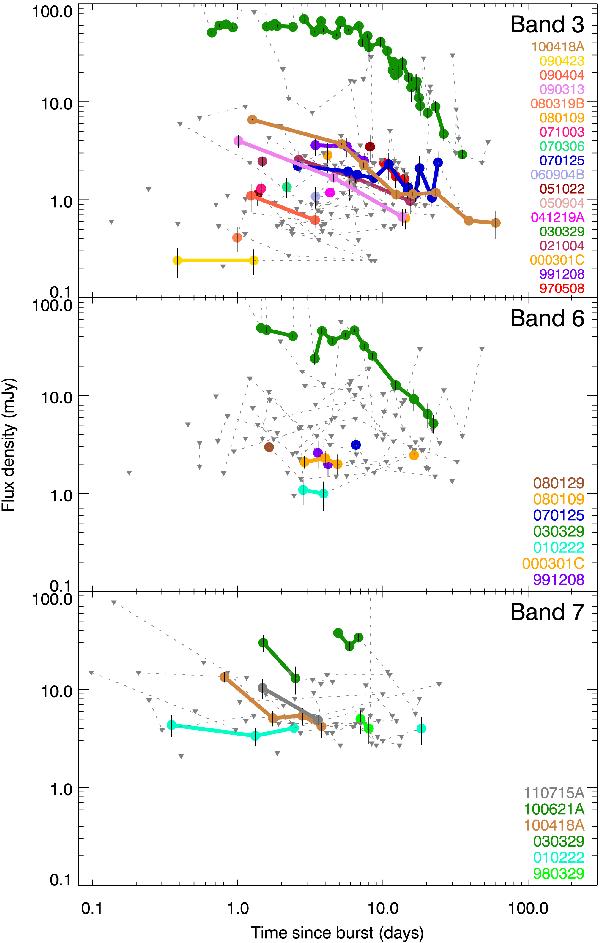
Light curves of GRB afterglows in the different bands (see Table 2 for a definition of the bands). Coloured dots indicate detections, while gray triangles are 3σ detection limits. Observations of an individual burst are connected by a thick coloured line in case of detections and a thin dotted line in case of detection limits. GRBs with only one observation are shown as individual symbols with no connecting lines. Detections of GRB 010222 in bands 6 and 7 are due to the host galaxy and not the afterglow. The detection of XT 080109 in band 6 is due to the host galaxy.
Current usage metrics show cumulative count of Article Views (full-text article views including HTML views, PDF and ePub downloads, according to the available data) and Abstracts Views on Vision4Press platform.
Data correspond to usage on the plateform after 2015. The current usage metrics is available 48-96 hours after online publication and is updated daily on week days.
Initial download of the metrics may take a while.