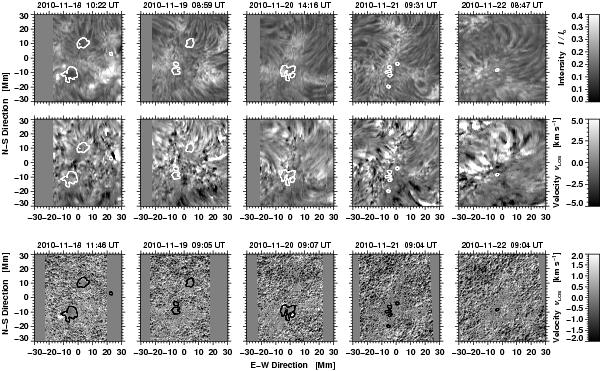
Fig. 8

VTT Echelle spectra were used to study the chromospheric evolution of active region NOAA 11126 during the period from 2010 November 18 − 22. The chromospheric fibril structure surrounding the decaying sunspots can be traced in Hαλ656.28 nm line core intensity (top) and LOS velocity (middle) maps. In addition, photospheric LOS velocities (bottom) were derived from Hinode/SP Fe i λ630.25 nm spectra. The FOV matches those of Figs. 5 and 6. Regions not covered by the spectral data are shown in medium gray. The times above the panels refers to the start of a spectral scan.
Current usage metrics show cumulative count of Article Views (full-text article views including HTML views, PDF and ePub downloads, according to the available data) and Abstracts Views on Vision4Press platform.
Data correspond to usage on the plateform after 2015. The current usage metrics is available 48-96 hours after online publication and is updated daily on week days.
Initial download of the metrics may take a while.


