Fig. 7
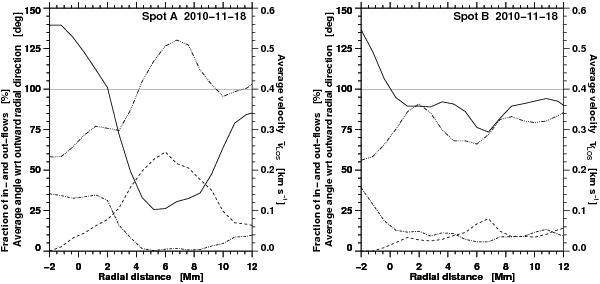
Radial dependence of parameters characterizing the flow fields of spots A (left) and B (right). Radial distances are measured from the outer boundary of the spots, i.e., 0.0 Mm marks the transition from penumbra to granulation. The thick black curves indicate the average angle of horizontal flow vectors with respect to the outward radial direction. High values refer to inward flows and low values indicate outward flow vectors. Fractions of in-/out-ward flow vectors as defined in the text are shown as dash-dotted and dashed lines, respectively. The horizontal straight lines denotes the 100%level. The average flow speed is displayed as a dash-dot-dot-dotted line.
Current usage metrics show cumulative count of Article Views (full-text article views including HTML views, PDF and ePub downloads, according to the available data) and Abstracts Views on Vision4Press platform.
Data correspond to usage on the plateform after 2015. The current usage metrics is available 48-96 hours after online publication and is updated daily on week days.
Initial download of the metrics may take a while.