Fig. 5
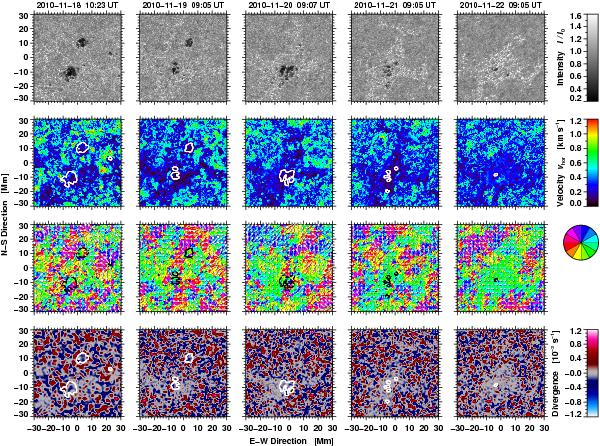
G-band images (top) after correction of geometrical foreshortening tracing the photospheric evolution of the central part of active region NOAA 11126 (from left to right 2010 November 18 − 22). The horizontal flow speeds (2nd row) are given by the velocity scale to the right. The direction of the horizontal flows (3rd row) are displayed according to the color-wheel and arrows for which a velocity of 1 km s-1 corresponds to exactly the grid spacing. The divergence of the horizontal flow field (bottom) are presented according to the scale on the right, where gray indicates divergence values close to zero. All G-band images and LCT maps were aligned so that the center of the panels coincides with a latitude of 31.9° south. The white and black contours outline the location of the small sunspot/pores. Times refer to the first image of the time-series, which was used to compute the flow maps.
Current usage metrics show cumulative count of Article Views (full-text article views including HTML views, PDF and ePub downloads, according to the available data) and Abstracts Views on Vision4Press platform.
Data correspond to usage on the plateform after 2015. The current usage metrics is available 48-96 hours after online publication and is updated daily on week days.
Initial download of the metrics may take a while.