Fig. 3
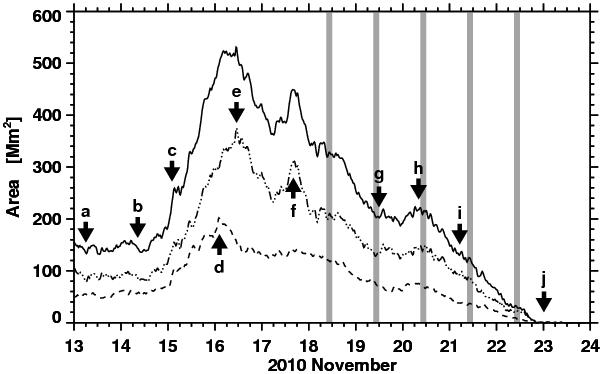
Temporal evolution of the area covered by active region NOAA 11126 as it crossed the solar disk. The area enclosed by umbral cores and pores is displayed with a dashed line. Dashed dot dot line refers to the penumbra, whereas the solid line denotes the total area. Some smoothing was applied to the time-series to suppress features on temporal scales shorter than one hour. The vertical gray bars refer to the observing periods of HOP 0176 (2010 November 18 − 22). The labels indicate different stages of active region evolution, which are explained in Sect. 3.1.
Current usage metrics show cumulative count of Article Views (full-text article views including HTML views, PDF and ePub downloads, according to the available data) and Abstracts Views on Vision4Press platform.
Data correspond to usage on the plateform after 2015. The current usage metrics is available 48-96 hours after online publication and is updated daily on week days.
Initial download of the metrics may take a while.