Fig. 1
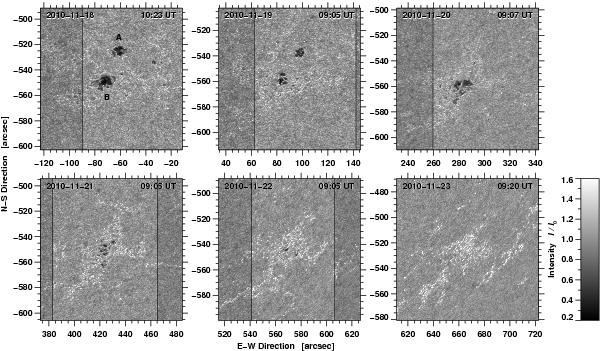
Calibrated Hinode G-band images showing the decay of active region NOAA 11126 observed during the period 2010 November 18 − 23 (from top-left to bottom-right). The FOV is 111″ × 111″. The annotation of the axes refers to heliocentric coordinates given in seconds of arc. Brighter areas delineated by vertical black lines correspond to regions, which were covered by spectral scans obtained with the VTT echelle spectrograph. The intensity scale to the right applies to these regions, while areas not covered by echelle data are displayed with an offset of 0.1I0. On 2010 November 23, only few Hinode G-band images were available. The limb darkening was subtracted from the G-band images, which were then normalized so that the mean of the quiet Sun intensity distribution corresponds to unity.
Current usage metrics show cumulative count of Article Views (full-text article views including HTML views, PDF and ePub downloads, according to the available data) and Abstracts Views on Vision4Press platform.
Data correspond to usage on the plateform after 2015. The current usage metrics is available 48-96 hours after online publication and is updated daily on week days.
Initial download of the metrics may take a while.