Fig. 1
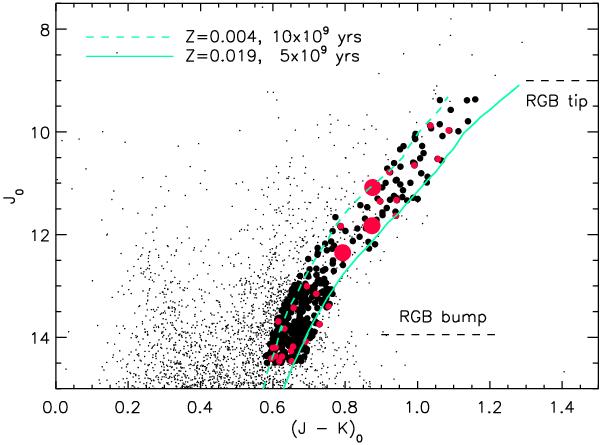
2MASS Colour−magnitude diagram of the field around (l,b) = (0°, −10°). Stars not observed in the present programme are plotted as black dots, observed targets as black circles, stars moderately enriched in Li as small red circles, and Li-rich stars as big red circles. Two RGB isochrones from Girardi et al. (2000), with metallicities and ages as indicated in the legend, are also included. The isochrones are truncated at the tip of the RGB.
Current usage metrics show cumulative count of Article Views (full-text article views including HTML views, PDF and ePub downloads, according to the available data) and Abstracts Views on Vision4Press platform.
Data correspond to usage on the plateform after 2015. The current usage metrics is available 48-96 hours after online publication and is updated daily on week days.
Initial download of the metrics may take a while.