Fig. 3
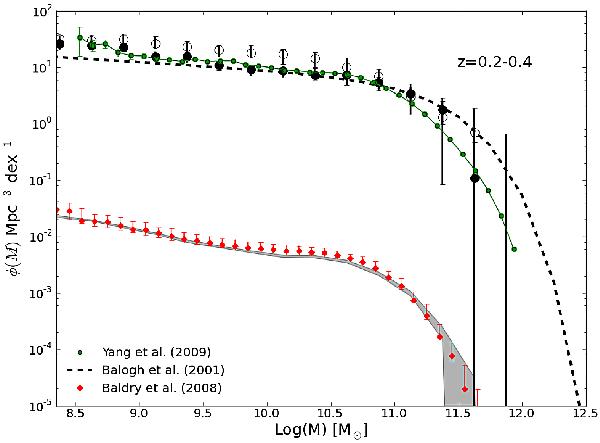
Comparison of the galaxy stellar mass distribution for all galaxies in the COSMOS area (light gray shaded area) and X-ray detected low-mass (large filled circles) and high-mass (large empty circles) groups at z = 0.2–0.4. The diamonds mark the GSMF obtained by Baldry et al. (2008) for the field. The small green circles show the GSMF of an optically selected groups sample from SDSS. The dashed black line marks the galaxy stellar mass function by Balogh et al. (2001) estimated for a sample of optically detected groups in the Las Campanas redshift survey (Christlein 2000) with a velocity dispersion of less than 400 km s-1.
Current usage metrics show cumulative count of Article Views (full-text article views including HTML views, PDF and ePub downloads, according to the available data) and Abstracts Views on Vision4Press platform.
Data correspond to usage on the plateform after 2015. The current usage metrics is available 48-96 hours after online publication and is updated daily on week days.
Initial download of the metrics may take a while.