Fig. 13
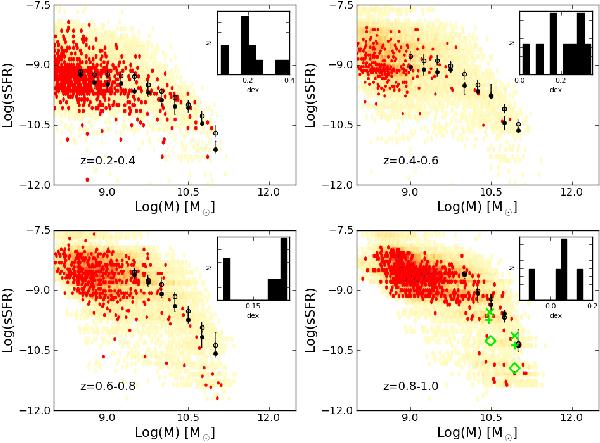
Specific star-formation rate versus stellar mass for star-forming galaxies in groups (red) and the field (yellow). Individual points are re-binned in hexagons and only bins with more than two counts are shown. Black filled points show the median for the groups, empty ones for the field. Inset histograms show the distribution of the difference between the median relation in groups and in the field. Green symbols at z = 0.8–1.0 are obtained from MIPS stacking by Patel et al. (2009) and represent the field (crosses), groups (plus sign) and clusters (diamonds).
Current usage metrics show cumulative count of Article Views (full-text article views including HTML views, PDF and ePub downloads, according to the available data) and Abstracts Views on Vision4Press platform.
Data correspond to usage on the plateform after 2015. The current usage metrics is available 48-96 hours after online publication and is updated daily on week days.
Initial download of the metrics may take a while.