Fig. 1
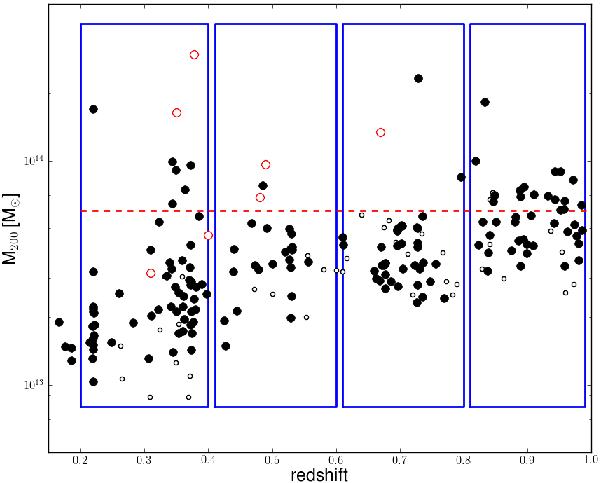
Distribution of M200 as a function of redshift for the X-ray detected groups in the COSMOS survey up to z = 1.0. The black filled circles are the COSMOS groups used in this work. Large red open circles mark the systems excluded from the analysis because they are out of the SUBARU area. Small empty circles mark low-significance and low-quality groups excluded from the analysis. Rectangles show the redshift bins in which the sample is divided, while the dashed lines show the threshold we used to define “high-mass” and “low-mass” groups (6 × 10¹³ M⊙).
Current usage metrics show cumulative count of Article Views (full-text article views including HTML views, PDF and ePub downloads, according to the available data) and Abstracts Views on Vision4Press platform.
Data correspond to usage on the plateform after 2015. The current usage metrics is available 48-96 hours after online publication and is updated daily on week days.
Initial download of the metrics may take a while.