Free Access
Fig. 4
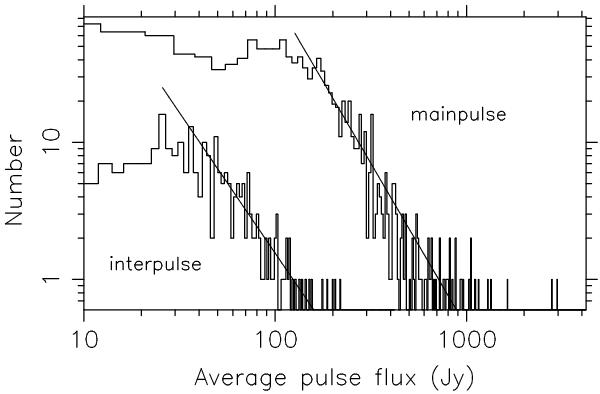
Plot showing the distribution of the average flux density for the pulses found at the main- and interpulse phases at the band centred at 173.85 MHz. Giant pulses detected in other bands show a similar trend. Also shown are the power law fits to the distributions and the values are listed in Table 3.
Current usage metrics show cumulative count of Article Views (full-text article views including HTML views, PDF and ePub downloads, according to the available data) and Abstracts Views on Vision4Press platform.
Data correspond to usage on the plateform after 2015. The current usage metrics is available 48-96 hours after online publication and is updated daily on week days.
Initial download of the metrics may take a while.