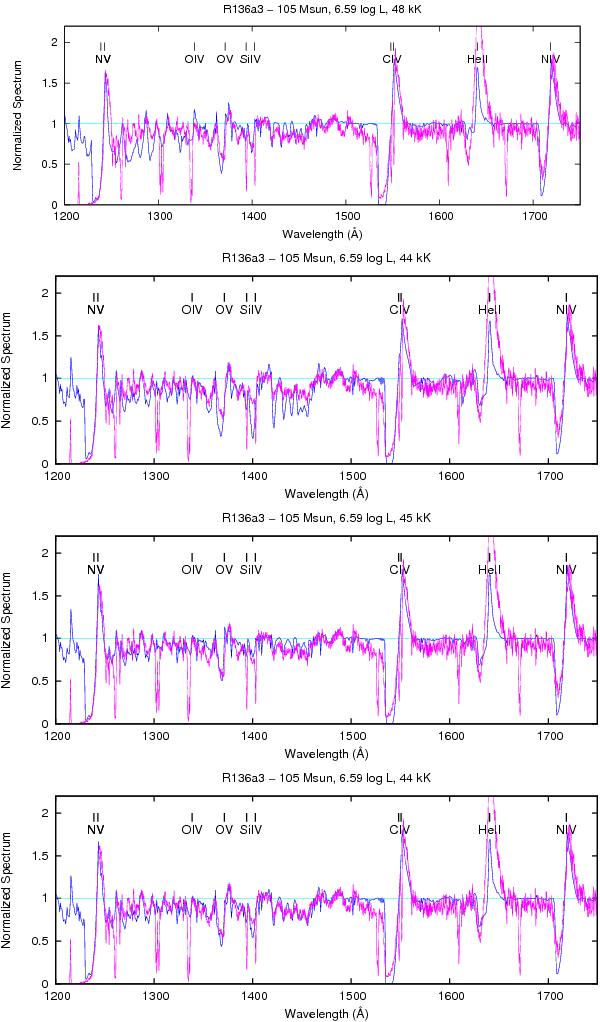
Fig. 23

Synthetic UV spectra of a consistently calculated model sequence in comparison with the observed UV spectrum of the WN5h star R136a3. The calculated spectra represent our current best model (A∗) in the lowest panel (cf. Table 14), as well as model calculations in the panels above whose changes in the parameters can be ruled out. The uppermost panel shows clearly the result of a too high effective temperature (Teff = 48 kK), as it reflects too strong Fe vi wind-contaminated lines in the wavelength range from 1250 to 1400 Å whereas the Fe v lines in the wavelength range from 1400 to 1550 Å are much too weak. In the second panel it is easily recognized by a comparison to the observed spectrum shown that this problem is solved by adopting a lower value of the effective temperature (Teff = 44 kK). However, now the spectral signatures of both ionization stages – Fe v and Fe vi – are too strong. This problem can be solved by a reduction of the abundances of iron and nickel by a factor of 2.0 and a small increase of the effective temperature (Teff = 45 kK). Now, as is shown in the third panel the Fe vi lines are quite well in agreement with the observed structures, but the Fe v lines in the range from 1400 to 1550 Å are again somewhat too weak. In the last step – lowest panel – the effective temperature has been reduced slightly again to the value of Teff = 44 kK and the abundances of iron and nickel have been decreased just by a factor of 1.5. Apart from the He ii line at 1640 Å (see text) the spectrum is now quite well in agreement with the observations.
Current usage metrics show cumulative count of Article Views (full-text article views including HTML views, PDF and ePub downloads, according to the available data) and Abstracts Views on Vision4Press platform.
Data correspond to usage on the plateform after 2015. The current usage metrics is available 48-96 hours after online publication and is updated daily on week days.
Initial download of the metrics may take a while.


