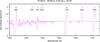
Fig. 22
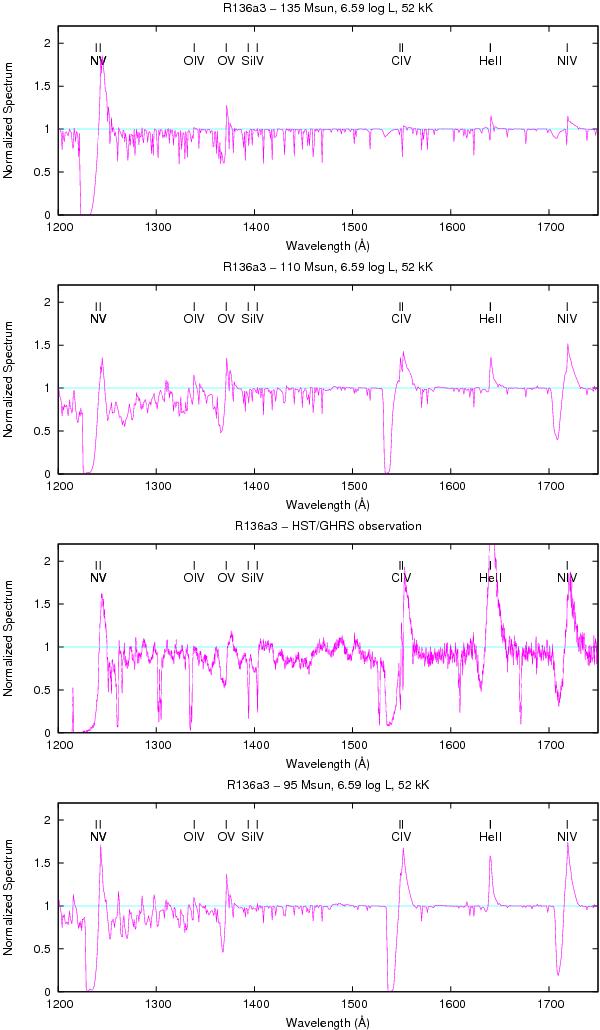
Calculated and observed UV spectra for the WN5h star R136a3. The calculated spectra represent our prototype model (model A+ – lowest panel), whereas the model in the upper panel (model A−) shows the result of our consistently calculated dynamical values based on the stellar parameter set of Crowther et al. (2010). As a consequence of the assumed compactness of the object21 the result of a too low mass loss rate Ṁ and a too high terminal velocity v∞ of this model (cf. Table 12) is easily recognized by a comparison to the observed spectrum shown in the third panel22. The spectrum presented in the second panel shows clearly that a moderate reduction of the stellar mass along with an enhancement of the abundances of iron and nickel – which leads to an enhancement of Ṁ – does not solve the problem (“model A” in Table 13), because the Fe lines start to become too strong in the emission parts of the N v and C iv resonance lines23. On the other hand, model A+ (lowest panel) is not affected by these weak points. Although the He ii line at 1640 Å is somewhat too weak, the spectrum is together with the dynamical parameters (cf. Table 13) in quite good agreement with the observations24.
Current usage metrics show cumulative count of Article Views (full-text article views including HTML views, PDF and ePub downloads, according to the available data) and Abstracts Views on Vision4Press platform.
Data correspond to usage on the plateform after 2015. The current usage metrics is available 48-96 hours after online publication and is updated daily on week days.
Initial download of the metrics may take a while.