Fig. 9
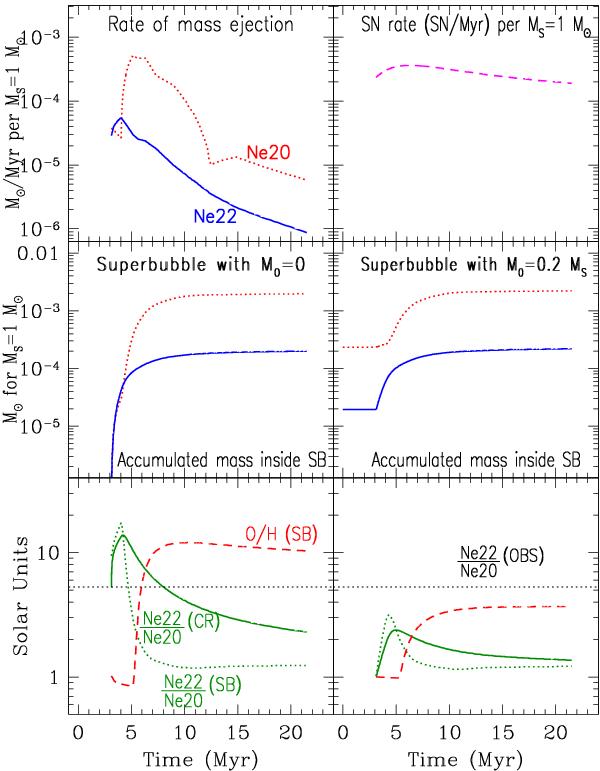
Evolution of composition in a superbubble. Top left: ejection rate of 20Ne (dotted) and 22Ne (solid) in M⊙/Myr per 1 M⊙ of stars formed (assuming a Salpeter IMF between 0.1 and 120 M⊙). Top right: supernova rate per Myr. Middle: total mass of 20Ne (dotted) and 22Ne (solid) accumulated in the superbubble for no initial gas (M0 = 0, left) and for an initial mass of gas equal to 1/5 of the formed stars (M0 = 0.20, right); in the former case 22Ne dominates by mass early on, whereas in the latter the mass of 20Ne dominates from the very beginning. Bottom: corresponding evolution of the O/H (dashed) and of the (22Ne/20Ne)SB ratio (dotted) in the SB gas; the solid curve represents the (22Ne/20Ne)CR ratio of particles accelerated up to that time and has to be compared to the observed GCR source ratio (dotted horizontal line).
Current usage metrics show cumulative count of Article Views (full-text article views including HTML views, PDF and ePub downloads, according to the available data) and Abstracts Views on Vision4Press platform.
Data correspond to usage on the plateform after 2015. The current usage metrics is available 48-96 hours after online publication and is updated daily on week days.
Initial download of the metrics may take a while.