Fig. 6
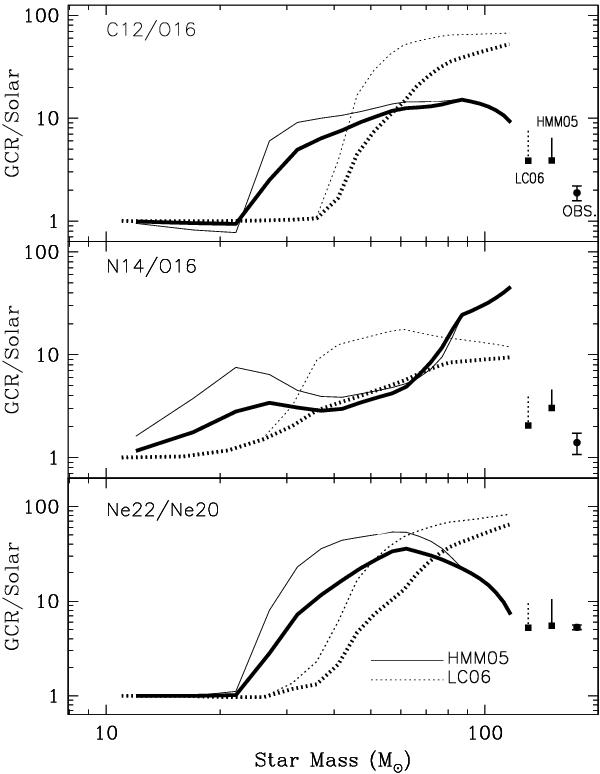
Abundance ratios of various nuclear species in GCR source normalized to the corresponding solar ones as a function of the initial stellar mass. In all panels, solid curves correspond to models of HMM05 and dotted curves to models of LC06. Upper, thin curves are for GCR accelerated at the beginning of the ST phase and lower, thick curvesfor the time-average at the end of GCR acceleration. An average over a Salpeter IMF (and accounting for the swept-up mass in each case) produces the vertical segments to the right, their top point corresponding to the beginning and the bottom one to the end of the GCR acceleration phase, respectively (also indicated by filled squares). These results are compared to GCR source abundance ratios as derived by ACE data (points at the extreme right with error bars) in Binns et al. (2005). The most significant, unaffected by FIP, volatility etc., is the one of 22Ne/20Ne. The end of the GCR acceleration phase is assumed to correspond to shock velocities υmin such that the time and IMF averaged theoretical ratio (squares) of 22Ne/20Ne matches the observed one (see text). For the set-up adopted here we find υmin = 1900 km s-1 for HMM models and υmin = 2400 km s-1 for LC06 models.
Current usage metrics show cumulative count of Article Views (full-text article views including HTML views, PDF and ePub downloads, according to the available data) and Abstracts Views on Vision4Press platform.
Data correspond to usage on the plateform after 2015. The current usage metrics is available 48-96 hours after online publication and is updated daily on week days.
Initial download of the metrics may take a while.