Fig. 10
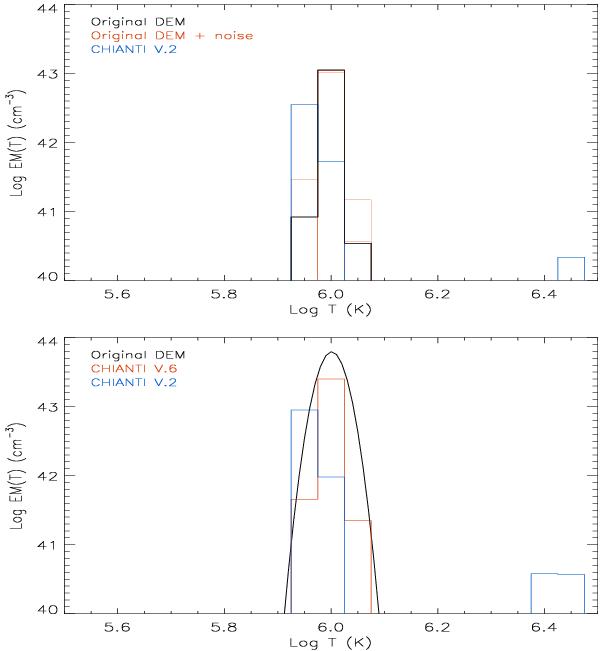
Comparison of EM(T) reconstructions of a plasma made of a single isothermal component (top) and a single Gaussian component (bottom); each reconstructed using two different versions of CHIANTI: version 6.0.1 (red curves) and 2 (blue curves). Thin lines in the top panel indicate the case with random noise added, from Sect. 3.1.
Current usage metrics show cumulative count of Article Views (full-text article views including HTML views, PDF and ePub downloads, according to the available data) and Abstracts Views on Vision4Press platform.
Data correspond to usage on the plateform after 2015. The current usage metrics is available 48-96 hours after online publication and is updated daily on week days.
Initial download of the metrics may take a while.