Fig. A.9
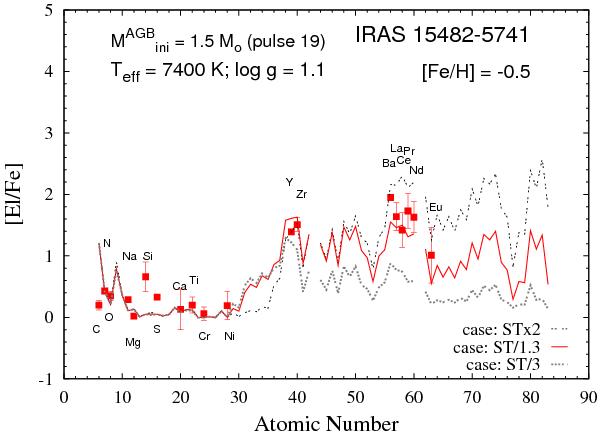
IRAS 15482–5741: the same as Fig. 4, but for  = 1.5 M⊙ models. These models do not provide good theoretical interpretations for two reasons: first of all, with respect to Fig. 4, a further increase of about 0.2 dex is predicted for [C/Fe], because higher initial masses more TDUs (specifically, 19 instead of 11). Second, no good match is obtained of both ls and hs peaks: [ls/Fe] is perfectly interpreted by a case ST × 2, but [hs/Fe] is too high with respect the observed value. But, case ST/1.3 predicts a [ls/Fe] slightly higher than observed, even if the theoretical [hs/Fe] still lies within the errorbars.
Current usage metrics show cumulative count of Article Views (full-text article views including HTML views, PDF and ePub downloads, according to the available data) and Abstracts Views on Vision4Press platform.
Data correspond to usage on the plateform after 2015. The current usage metrics is available 48-96 hours after online publication and is updated daily on week days.
Initial download of the metrics may take a while.