Fig. 6
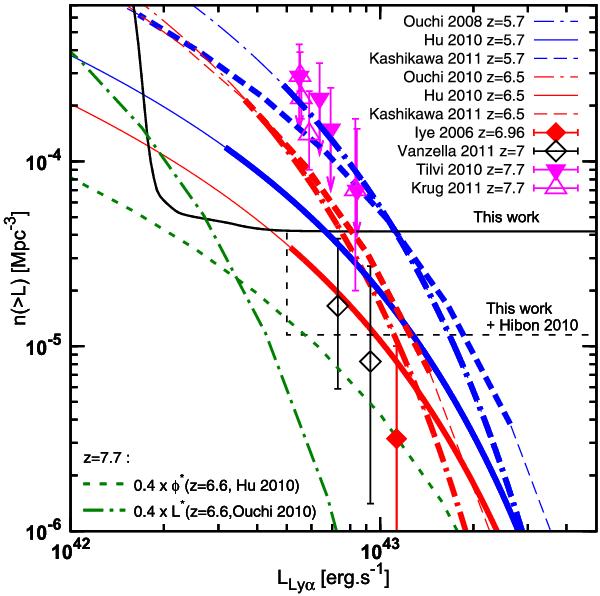
Cumulative Lyα luminosity functions. The blue (resp. red) lines show the cumulative luminosity functions at z = 5.7 (resp. z = 6.5) from Ouchi et al. (2008) (dotted-dashed lines), Hu et al. (2010) (plain lines) and Kashikawa et al. (2011) (dotted lines). The transitions to thin lines indicate the range of the luminosities probed by the observations. A fixed faint end slope of –1.5 is assumed. The parameter space probed by the HAWK-I observations is delimited by the black line, with the black dashed line corresponding to the HAWK-I observations and the null detection of the bright candidates of Hibon et al. (2010) mentioned in the text. The green dotted line corresponds to a 60% evolution in density of the Hu et al. (2010) LF, and the short-dashed-long-dashed line corresponds to a 60% evolution in luminosity of the Ouchi et al. (2010)z = 6.5 LF. The red filled diamond corresponds to the Iye et al. (2006) LAE detection at a redshift of 6.96. The black open diamonds correspond to the Vanzella et al. (2011) LAE detections at redshifts of 7.008 and 7.109. The magenta downward-pointing filled (resp. open) triangles are the photometric candidates at z = 7.7 from Tilvi et al. (2010) (resp. Krug et al. 2012).
Current usage metrics show cumulative count of Article Views (full-text article views including HTML views, PDF and ePub downloads, according to the available data) and Abstracts Views on Vision4Press platform.
Data correspond to usage on the plateform after 2015. The current usage metrics is available 48-96 hours after online publication and is updated daily on week days.
Initial download of the metrics may take a while.