Fig. 5
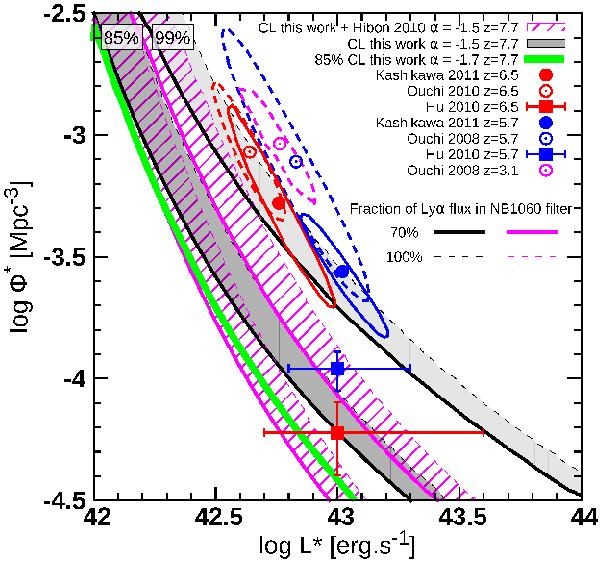
Parameters of the z = 7.7 luminosity function excluded at 85% and 99% confidence levels from our data, assuming the Schechter formalism and a fixed faint end slope α = −1.5 unless otherwise stated. Filled circles correspond to the best fit LF parameters at z = 5.7 (blue) and z = 6.5 (red) from Kashikawa et al. (2011). The ellipses correspond to the 3σ confidence levels for these datapoints. Open circles correspond to the best fit LF parameters of the photometric samples of Ouchi et al. (2008) at z = 3.1 (magenta) and z = 5.7 (blue) and of Ouchi et al. (2010) at z = 6.5 (red). The ellipses correspond to the 2σ confidence levels for these datapoints. The filled square symbols correspond to the best fit LAE LF parameters at z = 5.7 (blue) and z = 6.5 (red) from Hu et al. (2010). The plain (resp. dotted) black lines correspond to the 85% and 99% confidence levels corresponding to no detections in our HAWK-I data (this work), assuming a conversion factor of 70% (resp. 100%) between the NB1060 and Lyα fluxes. The dark (resp. light) grey zones correspond to the range of 85% (resp. 99%) confidence levels for conversion factors between 70% and 100%, as delimited by the plain and dotted lines. Similarly, the lines and hatched zones in magenta colour correspond to the 85% and 99% confidence levels when adding to our work the null spectroscopic confirmation of the five brightest z = 7.7 LAE candidates of Hibon et al. (2010).
Current usage metrics show cumulative count of Article Views (full-text article views including HTML views, PDF and ePub downloads, according to the available data) and Abstracts Views on Vision4Press platform.
Data correspond to usage on the plateform after 2015. The current usage metrics is available 48-96 hours after online publication and is updated daily on week days.
Initial download of the metrics may take a while.