Fig. 1
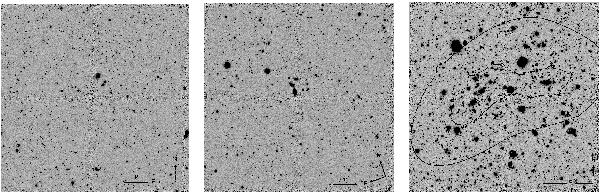
Images of the CFHTLS-D4 (left), GOODS-South (centre), and Bullet Cluster (right) fields as in the final NB1060 image stacks. The inner and outer black contours on the Bullet Cluster image represent the regions where the gravitational amplification is respectively ≥ 2.5 (Δm ≤ −1) and ≥ 1.2 (Δm ≤ −0.2) for a source at redshift z = 7.7.
Current usage metrics show cumulative count of Article Views (full-text article views including HTML views, PDF and ePub downloads, according to the available data) and Abstracts Views on Vision4Press platform.
Data correspond to usage on the plateform after 2015. The current usage metrics is available 48-96 hours after online publication and is updated daily on week days.
Initial download of the metrics may take a while.