Fig. 3
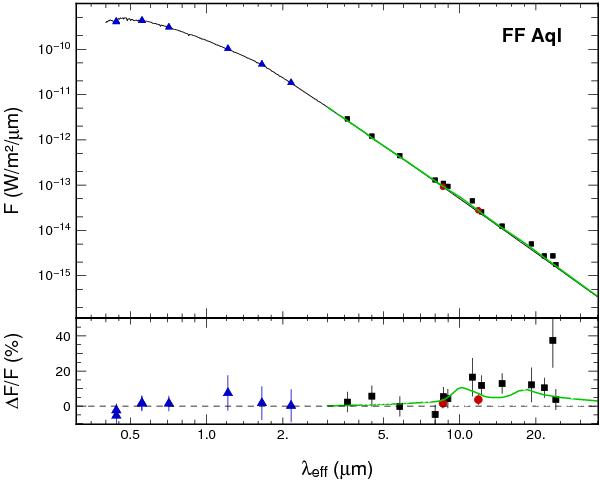
Synthetic spectra of the classical Cepheid FF Aql (solid line) with the photometric measurements taken from the literature. The blue triangles are the points used to fit the SED. Our measurements are presented with the red circles, while the black squares are the other photometric data. In the lower panel, we plot the excess flux density relative to the photospheric emission. The green curve represents the flux density model.
Current usage metrics show cumulative count of Article Views (full-text article views including HTML views, PDF and ePub downloads, according to the available data) and Abstracts Views on Vision4Press platform.
Data correspond to usage on the plateform after 2015. The current usage metrics is available 48-96 hours after online publication and is updated daily on week days.
Initial download of the metrics may take a while.