Fig. 5
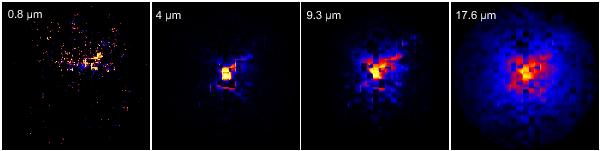
Images of the torus at different wavelengths. From left to right, panels represent model images at 0.83, 3.98, 9.31, and 17.6 μm. Images are in logarithmic scale. The visible squared structure is due to the clumps which in our model are in the form of cubes. The inclination is i = 50°; the values of other parameters are the same as taken in Fig. 3.
Current usage metrics show cumulative count of Article Views (full-text article views including HTML views, PDF and ePub downloads, according to the available data) and Abstracts Views on Vision4Press platform.
Data correspond to usage on the plateform after 2015. The current usage metrics is available 48-96 hours after online publication and is updated daily on week days.
Initial download of the metrics may take a while.