Fig. 4
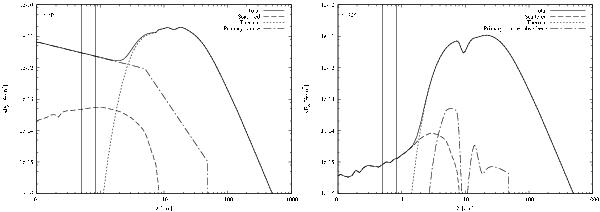
The total (solid line), thermal (dotted line), scattered (dashed line), and primary source (dash-dotted line) emission are plotted. The left panel is a type 1 inclination (i = 0°), the right panel a type 2 inclination (i = 90°). The two vertical lines indicate the central wavelengths of the two dispersing prisms of the Gaia photometric instrument (integrated with the astrometric instrument), at 0.50 and 0.82 μm. The values of torus parameters are the same as taken in Fig. 3.
Current usage metrics show cumulative count of Article Views (full-text article views including HTML views, PDF and ePub downloads, according to the available data) and Abstracts Views on Vision4Press platform.
Data correspond to usage on the plateform after 2015. The current usage metrics is available 48-96 hours after online publication and is updated daily on week days.
Initial download of the metrics may take a while.