Fig. 2
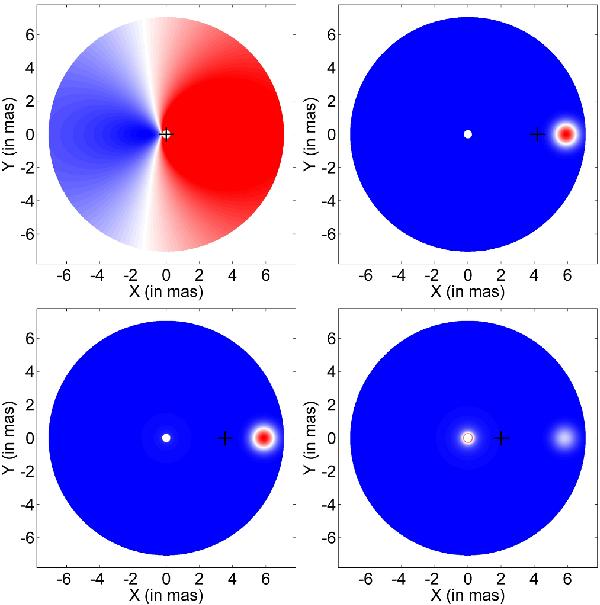
Simulations of the accretion disk without (top left) and with perturbation for three different values of emissivity index: a = 0 (top right), a = −1 (bottom left), and a = −2 (bottom right). The photocenter positions are denoted by crosses. In the top left panel, color represents the energy shift due to relativistic effects (i.e. ratio of the observed to emitted energy), while in the other three panels it represents the observed flux (in arbitrary units). The inner and outer radii of the disk, as well as the position and width of the perturbing region, are the same as in Fig. 1. The maximum emissivity of the perturbing region is taken to be ten times greater than the emissivity of the disk at its inner radius. Linear distances are converted to angular units along the x and y axes assuming an accretion disk located at cosmological redshift z = 0.01 around the central black hole with mass of 1010 M⊙.
Current usage metrics show cumulative count of Article Views (full-text article views including HTML views, PDF and ePub downloads, according to the available data) and Abstracts Views on Vision4Press platform.
Data correspond to usage on the plateform after 2015. The current usage metrics is available 48-96 hours after online publication and is updated daily on week days.
Initial download of the metrics may take a while.