Fig. 5
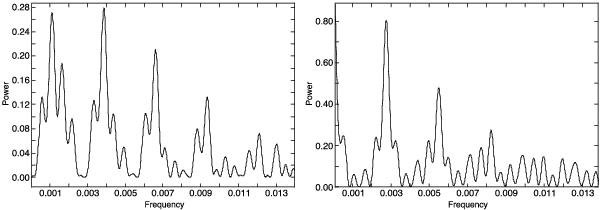
Power spectrum of the quiescent light curve of FS Aur (left panel) and its corresponding spectral window (right). The strongest peak in the window at fY = 0.00274 day-1 corresponds to the yearly observational cycle. The fVLPP = 0.001114 ± 0.00015 day-1 frequency corresponding to VLPP is the second-highest peak in the power spectrum, with the strongest peak being falias = 0.00114 + 0.00274 = 0.00388 day-1, an alias created by the beat between fVLPP and f1y.
Current usage metrics show cumulative count of Article Views (full-text article views including HTML views, PDF and ePub downloads, according to the available data) and Abstracts Views on Vision4Press platform.
Data correspond to usage on the plateform after 2015. The current usage metrics is available 48-96 hours after online publication and is updated daily on week days.
Initial download of the metrics may take a while.