Fig. 4
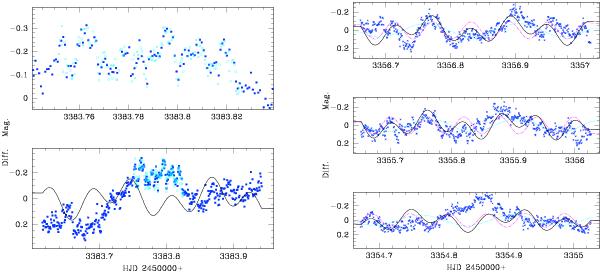
Examples of FS Aur photometry. The two lower panels show cases of large, ~0.5 mag bulges in the light curve. The left upper panel is simply a zoom of the central part of the lower panel, where we have overlapping data obtained from two different sites (solid and open points). The high-frequency oscillations are a good example of flickering. The solid black line is the sum of OP and LPP. The dotted cyan curve is a fit to the LPP and it is a continuation of the same curve as presented in Fig. 2. The dash-dotted magenta curve is a fit to the OP and it is seen only in certain epochs. The upper panels on right side are portions of the light curve well fitted with the sum of the OP and LPP periods.
Current usage metrics show cumulative count of Article Views (full-text article views including HTML views, PDF and ePub downloads, according to the available data) and Abstracts Views on Vision4Press platform.
Data correspond to usage on the plateform after 2015. The current usage metrics is available 48-96 hours after online publication and is updated daily on week days.
Initial download of the metrics may take a while.