Fig. 3
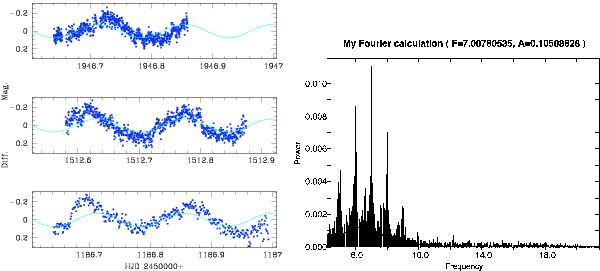
Selected portions of the light curve from different epochs in which the LPP is the dominating periodicity are presented in the left panel. The curve is a sinusoidal fit to the data, confirming phase stability of the periodicity from year to year. Similar light curves can be found in earlier observations (Tovmassian et al. 2003). The power spectrum calculated over a huge 1100-day time period shows a strong, single peak at the LPP frequency and its nightly aliases.
Current usage metrics show cumulative count of Article Views (full-text article views including HTML views, PDF and ePub downloads, according to the available data) and Abstracts Views on Vision4Press platform.
Data correspond to usage on the plateform after 2015. The current usage metrics is available 48-96 hours after online publication and is updated daily on week days.
Initial download of the metrics may take a while.