Fig. 2
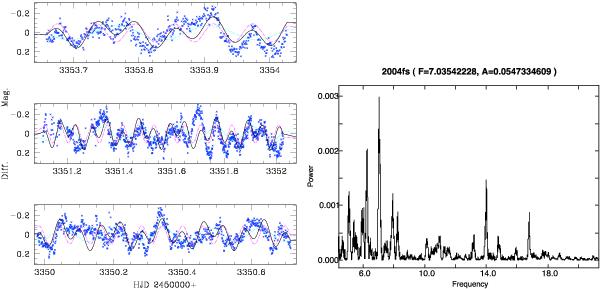
Portions of the light curve from the 2004 observations (left panels) and its power spectrum. The power spectrum is obtained from a larger data set spanning from JD 2 453 348 to 2 453 361. The highest peak of the power spectrum at fLPP = 7.0079 day-1 corresponds to the long photometric period (s. 2.2). The peak at fOP = 16.78 day-1 is, within errors, the orbital period determined from spectroscopy. The rest of the peaks in the power spectrum are either transient, or aliases, like the one at 2 × fLPP = 14.1. The lines on the light curve are sinusoidal fits of OP (dot-dashed; magenta), LPP (dotted; cyan) and the sum of both (black).
Current usage metrics show cumulative count of Article Views (full-text article views including HTML views, PDF and ePub downloads, according to the available data) and Abstracts Views on Vision4Press platform.
Data correspond to usage on the plateform after 2015. The current usage metrics is available 48-96 hours after online publication and is updated daily on week days.
Initial download of the metrics may take a while.