Fig. 11
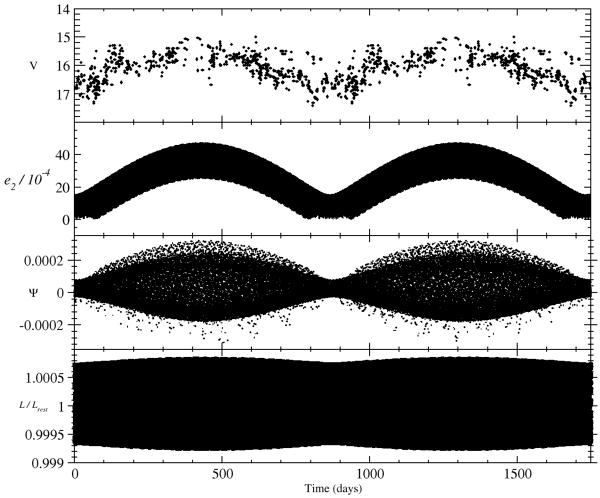
Light curve of FS Aur folded with the 875-day period (top panel). The number of points is reduced compared to Fig. 1 by averaging long nightly sequences to one point. In the second panel from the top, the eccentricity modulation is shown for the best solution to explain the VLPP (M3 = 48 MJ and P3/P2 = 13.4). The next panel depicts the variation of the Ψ parameter (see Eq. (4)). The percentual change in the position of inner Lagrangian point of the close binary is shown in the bottom panel. All curves are repeated for two periods for better visual presentation.
Current usage metrics show cumulative count of Article Views (full-text article views including HTML views, PDF and ePub downloads, according to the available data) and Abstracts Views on Vision4Press platform.
Data correspond to usage on the plateform after 2015. The current usage metrics is available 48-96 hours after online publication and is updated daily on week days.
Initial download of the metrics may take a while.