Fig. 10
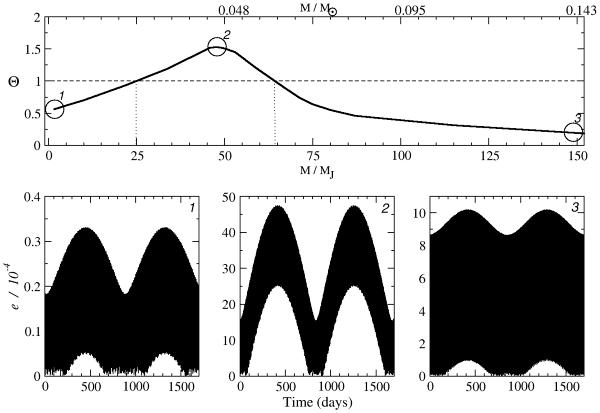
In the upper panel, the relative amplitude of the low frequency to the high frequency e2 modulations (Θ), see main text for definition, is plotted vs. the mass of the perturber. The higher Θ, the higher is the probability to detect the long-term modulation of the eccentricity. To show the effect on the shape of the resulting e2 modulation, three extreme cases are presented in the bottom panels: 1) a low-mass solution, with M3 = 2 MJ and P3/P2 = 23; 2) the solution with maximum eccentricity amplitude, with M3 = 48 MJ and P3/P2 = 13.4; 3) a high-mass solution, with M3 = 152 MJ and P3/P2 = 36.
Current usage metrics show cumulative count of Article Views (full-text article views including HTML views, PDF and ePub downloads, according to the available data) and Abstracts Views on Vision4Press platform.
Data correspond to usage on the plateform after 2015. The current usage metrics is available 48-96 hours after online publication and is updated daily on week days.
Initial download of the metrics may take a while.