Fig. 1
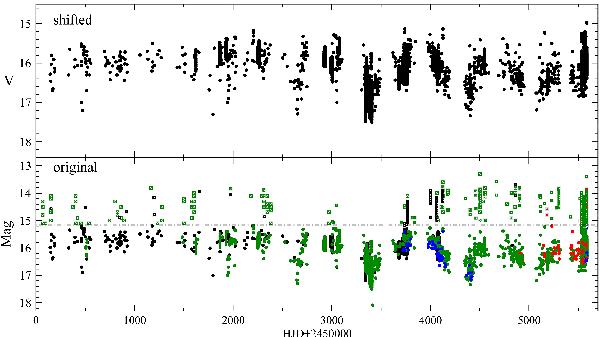
Long-term light curve of FS Aur. The data set includes exclusively CCD observations and is obtained predominately in the V-band (green circles) for the last 4000 days. The black symbols correspond to the data for which there is no information of the bandpass, but their average value is very close to the V-band. The data obtained in B and R filters are marked by blue and red circles, respectively. The open symbols corresponds to outbursts, which were duly separated using a V > 15.2 mag threshold.
Current usage metrics show cumulative count of Article Views (full-text article views including HTML views, PDF and ePub downloads, according to the available data) and Abstracts Views on Vision4Press platform.
Data correspond to usage on the plateform after 2015. The current usage metrics is available 48-96 hours after online publication and is updated daily on week days.
Initial download of the metrics may take a while.