Fig. 8
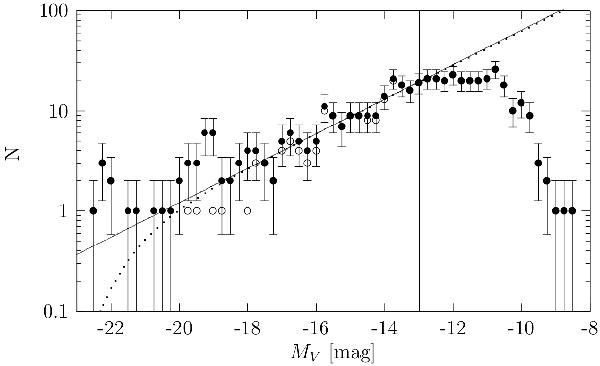
V-band luminosity function of the Virgo cluster sample (bin width:
0.5 mag, sampling step: 0.25 mag). Open symbols denote only early type galaxies,
solid symbols denote datapoints which were corrected by SDSS data. The solid line
indicates a linear fit performed in
−18.8 ≤ MV ≤ −13.0 mag. The
Schechter function fitted in the same interval with fixed
 mag is represented
by the dotted curve. The vertical line at
MV = −13.0 mag represents the
assumed completeness limit. The errors come from Poissonian statistics.
mag is represented
by the dotted curve. The vertical line at
MV = −13.0 mag represents the
assumed completeness limit. The errors come from Poissonian statistics.
Current usage metrics show cumulative count of Article Views (full-text article views including HTML views, PDF and ePub downloads, according to the available data) and Abstracts Views on Vision4Press platform.
Data correspond to usage on the plateform after 2015. The current usage metrics is available 48-96 hours after online publication and is updated daily on week days.
Initial download of the metrics may take a while.