Fig. 6
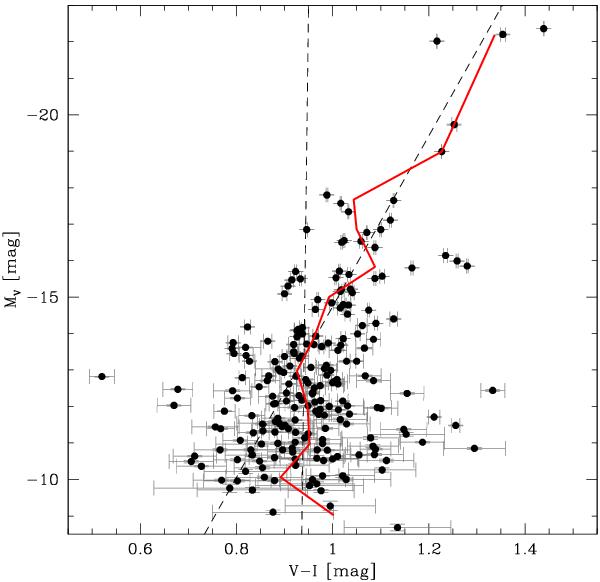
CMD of only the early-type Virgo sample is shown. The solid red line is constructed by the average measured in successive magnitude bins (1 mag per bin), the dashed black lines denote the CMR for the MV > −14 mag subsample, MV < −14 mag respectively. The errorbars shown here do not include the systematic uncertainty of the photometric zeropoint, as this would only cause an equal shift of all data points.
Current usage metrics show cumulative count of Article Views (full-text article views including HTML views, PDF and ePub downloads, according to the available data) and Abstracts Views on Vision4Press platform.
Data correspond to usage on the plateform after 2015. The current usage metrics is available 48-96 hours after online publication and is updated daily on week days.
Initial download of the metrics may take a while.