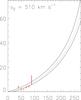
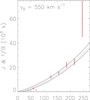
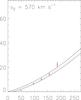
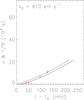
Fig. 7
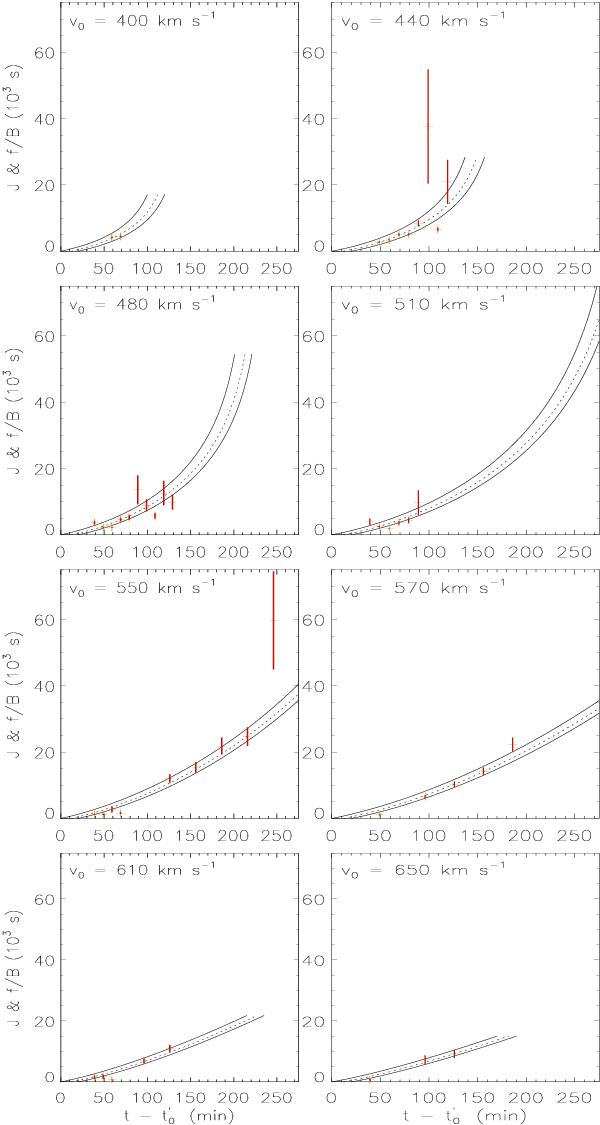
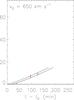
Comparison of the inverse of the observed brightness  times a fitted scaling factor f(v0) (red vertical bars) and the theoretical Jacobian J(t − t0,v0) (black dashed curve) as a function of time
  after jet initiation at t0.
  is a reference time at 04:46 UT. The different diagrams are obtained for different initial velocities v0, which lead to different particle orbits
  along which is recorded. The vertical range of the red bars indicates the estimated error in B. The width between the two solid black curves on both sides of the dased curve shows the variation of J due to an uncertainty in t0. For more details see text.
Current usage metrics show cumulative count of Article Views (full-text article views including HTML views, PDF and ePub downloads, according to the available data) and Abstracts Views on Vision4Press platform.
Data correspond to usage on the plateform after 2015. The current usage metrics is available 48-96 hours after online publication and is updated daily on week days.
Initial download of the metrics may take a while.