Fig. 5
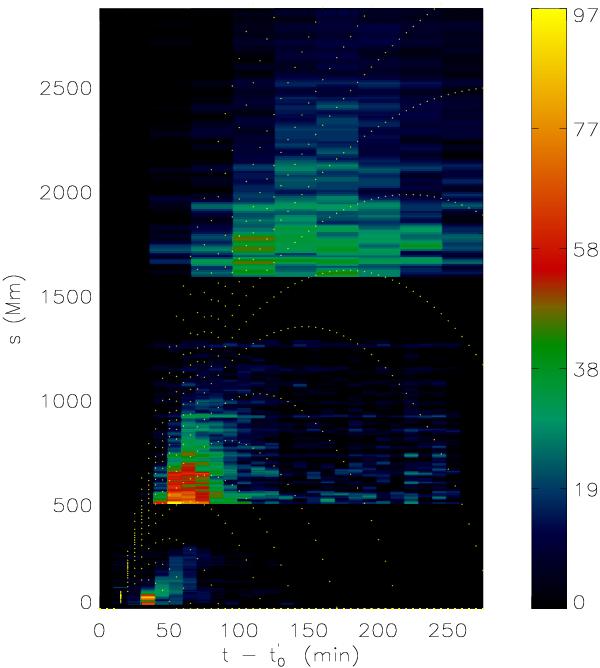
Image intensity for EUVI 304 and brightness for COR1 and COR2  as a function of time and distance along the jet axis.
  UT, which is a reference time. The intensities and brightnesses were integrated across the jet width from the difference images (Figs. 1 and 3). The color code on the right indicates the 304 intensity in units of number of photons. From bottom to top the yellow dotted lines indicate particle trajectories with different initial velocities of 250, 300, 350, 400, 425, 450, 475, 500, 515, 530, 545, 560, 575, 600, 650, and 700 km s-1.
Current usage metrics show cumulative count of Article Views (full-text article views including HTML views, PDF and ePub downloads, according to the available data) and Abstracts Views on Vision4Press platform.
Data correspond to usage on the plateform after 2015. The current usage metrics is available 48-96 hours after online publication and is updated daily on week days.
Initial download of the metrics may take a while.