Fig. 2
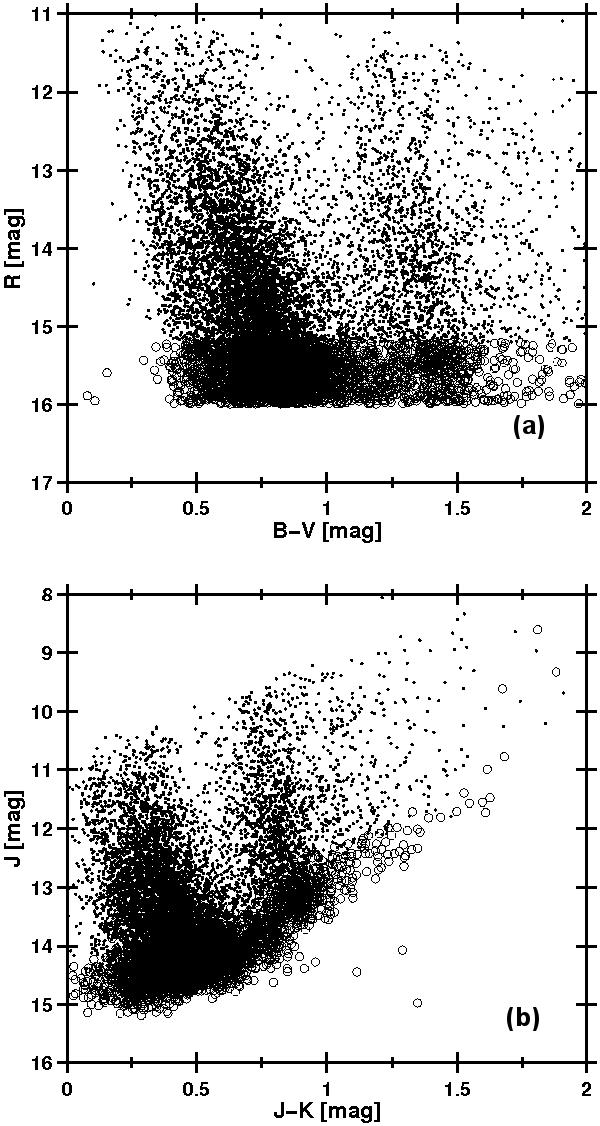
Top panel: r′ versus B − V color − magnitude diagram of the stars in the CoRoT LRa01 star field. The dots mark the bright stars (r′ ≲ 15.2 mag), for which three-color CoRoT lightcurves are available. The open circles mark the fainter stars (r′ ≳ 15.2 mag) with monochromatic lightcurves only. Main-sequence stars cluster in the left part of the diagram, giant stars in the right part. Bottom panel: 2MASS J versus J − Ks color − magnitude diagram of the stars in the CoRoT LRa01 field. Again, main-sequence stars cluster in the left part of the diagram, giant stars in the right part.
Current usage metrics show cumulative count of Article Views (full-text article views including HTML views, PDF and ePub downloads, according to the available data) and Abstracts Views on Vision4Press platform.
Data correspond to usage on the plateform after 2015. The current usage metrics is available 48-96 hours after online publication and is updated daily on week days.
Initial download of the metrics may take a while.