Fig. 14
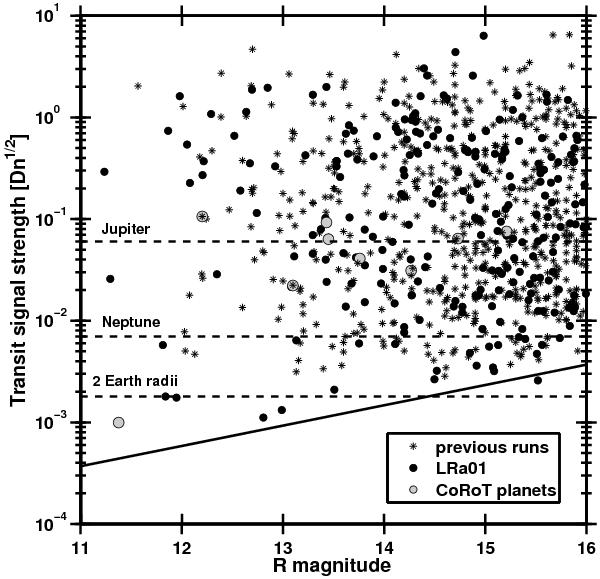
Transit signal strength versus r′ magnitude of detected planetary and binary candidates for the previous IRa01, SRc01, LRc01 CoRoT runs (asterisks), LRa01 run (filled circles), and first seven CoRoT-planets (open circles). D is the transit depth and n is the number of points in a transit event. The horizontal dashed lines represent (from top to bottom) the expected signal produced by a Jupiter-size planet, a Neptune-size planet, and a two-Earth radii planet around a solar-like star, respectively. Transit candidates and binaries were combined in this example to have a better statistical basis of the detection efficiency. The solid line represents the photon noise.
Current usage metrics show cumulative count of Article Views (full-text article views including HTML views, PDF and ePub downloads, according to the available data) and Abstracts Views on Vision4Press platform.
Data correspond to usage on the plateform after 2015. The current usage metrics is available 48-96 hours after online publication and is updated daily on week days.
Initial download of the metrics may take a while.