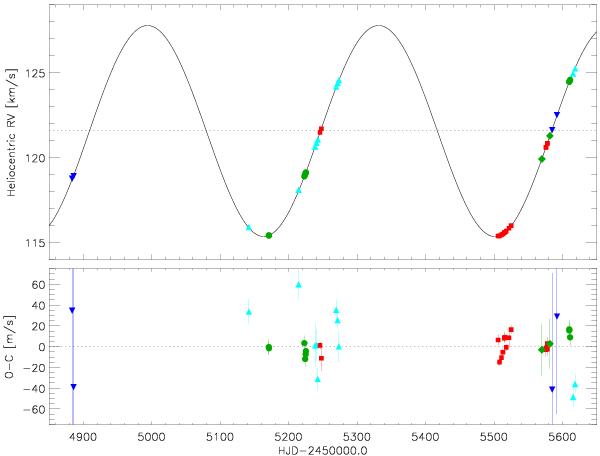
Fig. 11

Top panel: radial velocity curve of LRa01 E1 0286 as observed with Sandiford (blue downward triangles), SOPHIE (light blue upward triangles), HIRES (green circles), HARPS (red squares), and FIES (green diamonds). The solid line represents the best-fit Keplerian orbit to the data (see text for more details). An RV shift was let free to vary in the fit between the five data-sets. The systemic RV of Vγ = 121.603 km s-1, as derived from the HARPS data-set only, is plotted with a horizontal dotted line. Bottom panel: the RV residuals after subtracting the orbital solution (see the online edition of the journal for a color version of this figure).
Current usage metrics show cumulative count of Article Views (full-text article views including HTML views, PDF and ePub downloads, according to the available data) and Abstracts Views on Vision4Press platform.
Data correspond to usage on the plateform after 2015. The current usage metrics is available 48-96 hours after online publication and is updated daily on week days.
Initial download of the metrics may take a while.


