Fig. 10
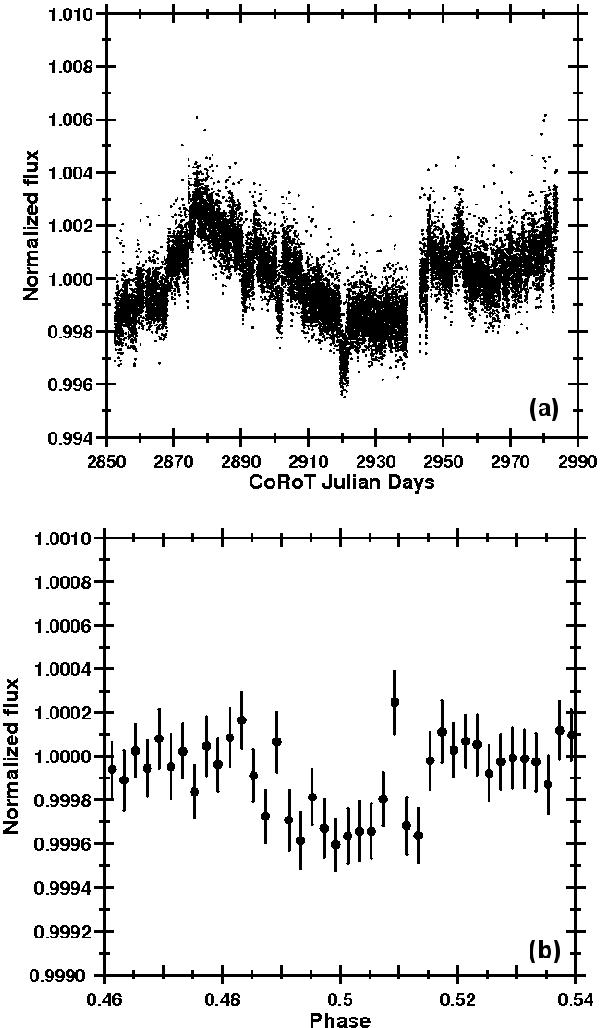
Top panel: raw white lightcurve of LRa01 E1 0286, which shows instrumental effects (jumps). Bottom panel: normalized and phase-folded white lightcurve of the transit candidate LRa01 E1 0286 at the period P = 3.60 days after filtering with ExoTrans (Grziwa et al. in prep.). Additional filtering was necessary to make the transit visible in this example.
Current usage metrics show cumulative count of Article Views (full-text article views including HTML views, PDF and ePub downloads, according to the available data) and Abstracts Views on Vision4Press platform.
Data correspond to usage on the plateform after 2015. The current usage metrics is available 48-96 hours after online publication and is updated daily on week days.
Initial download of the metrics may take a while.