Fig. 7
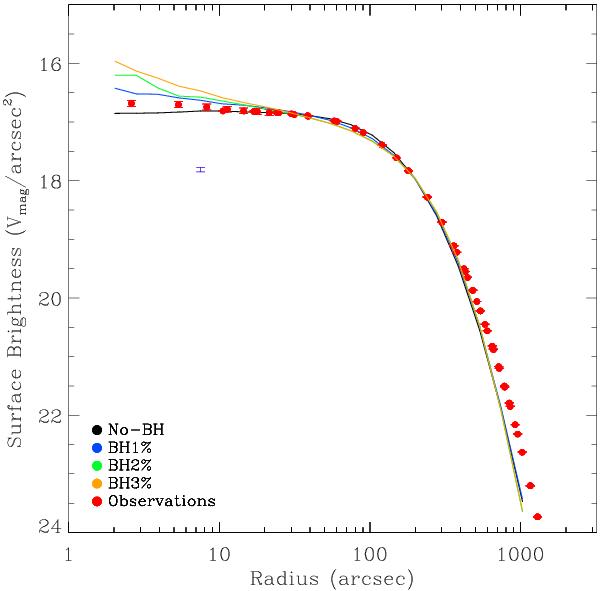
Surface brightness profile of models with different central black hole masses. Symbols and colors are the same as Fig. 6. The red points are the observed profile (Sect. 2). The black line is the best no-IMBH model which falls slightly below the observed data. The blue, green and yellow lines represent models with black hole masses of 1%, 2% and 3% of the cluster total mass.
Current usage metrics show cumulative count of Article Views (full-text article views including HTML views, PDF and ePub downloads, according to the available data) and Abstracts Views on Vision4Press platform.
Data correspond to usage on the plateform after 2015. The current usage metrics is available 48-96 hours after online publication and is updated daily on week days.
Initial download of the metrics may take a while.